Mapping protest
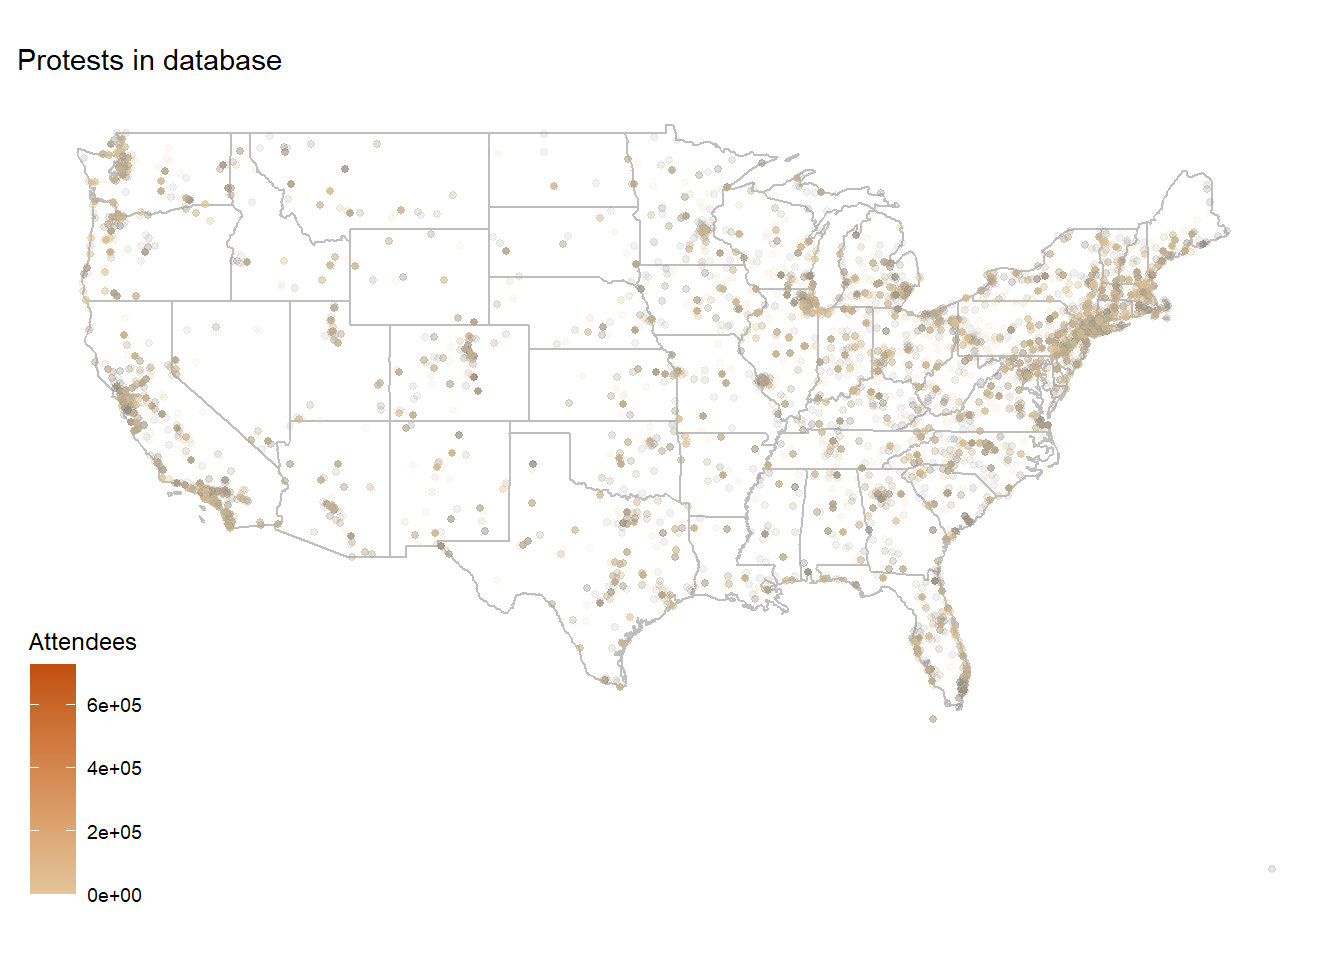
Thanks to the Data is Plural listserv, I discovered an incredible dataset. The website documents protests since 2017, tagging protest using a typology that could be very powerful for visualization (e.g. “Civil Rights”, “For Racial Justice”, “Police”, etc…). The dataset includes Location for each protest (descriptive string) but not coordinates. Here’s a script I built that can be used to link the original Location to coordinates and a few plots of the data.
Credit and Inspiration
- Thank you Open Street Map for making things easy and free. More on how to query OSM can be found here.
- Thanks to this post on StackExchange that gave essential clues about working with OSM in R.
- Most of all, WOW, thanks to the CountLove team. What an awesome dataset.
What you’ll need
library(tidyverse)
library(sf)
library(RJSONIO) # if you want to use OSM
library(lubridate) # this remains the worst package name ever
Clean the data
Load the original data downloaded here:
p <- read.csv("./data/protests.csv") %>%
  select(-c("Event..legacy..see.tags."))
glimpse(p)
## Rows: 27,038
## Columns: 7
## $ Date <fct> 2017-01-15, 2017-01-16, 2017-01-16, 2017-01-16, 2017...
## $ Location <fct> "Bowie State University, Bowie, MD", "Johnson City, ...
## $ Attendees <int> 1500, 300, 20, NA, 300, NA, NA, NA, 100, 2450, 1200,...
## $ Tags <fct> "Healthcare; For Affordable Care Act", "Civil Rights...
## $ Curated <fct> Yes, Yes, Yes, Yes, Yes, Yes, No, Yes, Yes, Yes, Yes...
## $ Source <fct> "http://www.capitalgazette.com/news/ph-ac-cn-aca-ral...
## $ Total.Articles <int> 1, 4, 1, 1, 1, 1, 1, 2, 1, 1, 1, 1, 1, 2, 1, 1, 1, 1...Let’s pull out the distinct Locations in the dataset and clean things up so we can transform CITYNAME, STATE into actual coordinates using ❤️OpenStreetMap❤️ :
cities <- distinct(p, Location)
cities$Location <- as.character(cities$Location)
cities$State <- trimws(toupper(substr(cities$Location, nchar(cities$Location) - 2, nchar(cities$Location))))

# filter Cuidad Juarez, Mexico, Space (LOL), and Guam
cities <- cities %>%
  filter(!State %in% c("ICO", "ACE", "GU"))
Space, hahaha, Nice. Ok, now let’s deal with the fact that some place names are longer than CITY, STATE, e.g. CLEMSON UNIVERSITY, CLEMSON, SC.1
cities$NC <- apply(cities, 1, function(x) length(unlist(strsplit(x[1], ","))))
cities$City <- NA
cities$City[cities$NC > 2] <- apply(cities, 1, function(x) unlist(strsplit(x[1], ","))[2])[cities$NC > 2]
cities$City[cities$NC == 2] <- apply(cities, 1, function(x) unlist(strsplit(x[1], ","))[1])[cities$NC == 2]
cities$City <- trimws(toupper(cities$City))
Now that we have a clean list of cities (City) and states (State), we can download coordinates2 for each city using OpenStreetMap and the RJSONIO package. Note: this takes awhile to run!
nrow <- nrow(cities)
counter <- 1
cities$lon[counter] <- 0
cities$lat[counter] <- 0
while (counter <= nrow){

  CityName <- cities$City[counter]
  CountryCode <- "US"
  StateName <- cities$State[counter]
  url <- paste(
    "http://nominatim.openstreetmap.org/search?city="
    , CityName
    , "&state="
    , StateName
    , "&countrycodes="
    , CountryCode
    , "&limit=9&format=json"
    , sep="")
  x <- fromJSON(url)
  if(is.vector(x)){
    cities$lon[counter] <- x[[1]]$lon
    cities$lat[counter] <- x[[1]]$lat
  }
  counter <- counter + 1
}
Let’s merge cities back with our full protest dataset and clean things up for plotting JOY.
pcm <- merge(cities, p, by = "Location", all = T)

# I like to break down date into smaller pieces to help me group and visualize in interesting ways so...
pcm$Date <- as.Date(pcm$Date, "%Y-%m-%d")
pcm <- pcm %>% mutate(Year = year(Date),
                      Day = day(Date),
                      Month = month(Date),
                      DOY = yday(Date))
# some cleaning
protests <- pcm %>%
  filter(State %in% unique(states$STATE_ABBR)) %>% # drops Guam, Space, Mexico, AK, HI
  distinct() %>% # checks for repeats
  filter(!is.na(lon), !is.na(lat)) %>% # drops coords that didn't work
  filter(lon != 0)  # note that this drops lots of protests, so have to go manually check for complete accurary
glimpse(protests)
## Rows: 26,452
## Columns: 15
## $ Location <chr> "26 Federal Plaza, New York, NY", "A. B. Miller High...
## $ State <chr> "NY", "CA", "NC", "FL", "WI", "LA", "LA", "LA", "IL"...
## $ City <chr> "NEW YORK", "FONTANA", "KANNAPOLIS", "JACKSONVILLE",...
## $ lon <chr> "-74.0060152", "-117.435048", "-80.621438", "-81.655...
## $ lat <chr> "40.7127281", "34.0922335", "35.4874708", "30.332183...
## $ Date <date> 2018-06-18, 2018-03-14, 2018-03-14, 2018-03-14, 201...
## $ Attendees <int> NA, 150, NA, NA, 40, 250, 70, NA, NA, 75, 40, 25, 30...
## $ Tags <fct> "Immigration; For compassionate immigration; Familie...
## $ Curated <fct> Yes, Yes, Yes, Yes, Yes, Yes, Yes, No, Yes, Yes, No,...
## $ Source <fct> http://newyork.cbslocal.com/2018/06/18/rally-illegal...
## $ Total.Articles <int> 1, 1, 2, 1, 1, 6, 1, 1, 1, 2, 1, 1, 2, 2, 1, 1, 1, 1...
## $ Year <dbl> 2018, 2018, 2018, 2018, 2018, 2018, 2018, 2020, 2018...
## $ Day <int> 18, 14, 14, 14, 14, 11, 15, 5, 14, 14, 6, 24, 18, 31...
## $ Month <dbl> 6, 3, 3, 3, 3, 1, 1, 5, 3, 3, 5, 3, 9, 5, 5, 6, 5, 5...
## $ DOY <dbl> 169, 73, 73, 73, 73, 11, 15, 126, 73, 73, 126, 83, 2...Houston we have coordinates! Note that some of the cities were not geocoded with OSM. I didn’t have the time to manually check these, but you’d want to do that prior to using this for anything serious.
Visualizations
Other relevant datasets and resources
- The Green Book
- Confederate Monuments
- Visualizations using the data here and here
On a personal note, way to go alma mater! It’s about time!↩
Assuming city centroid here?↩